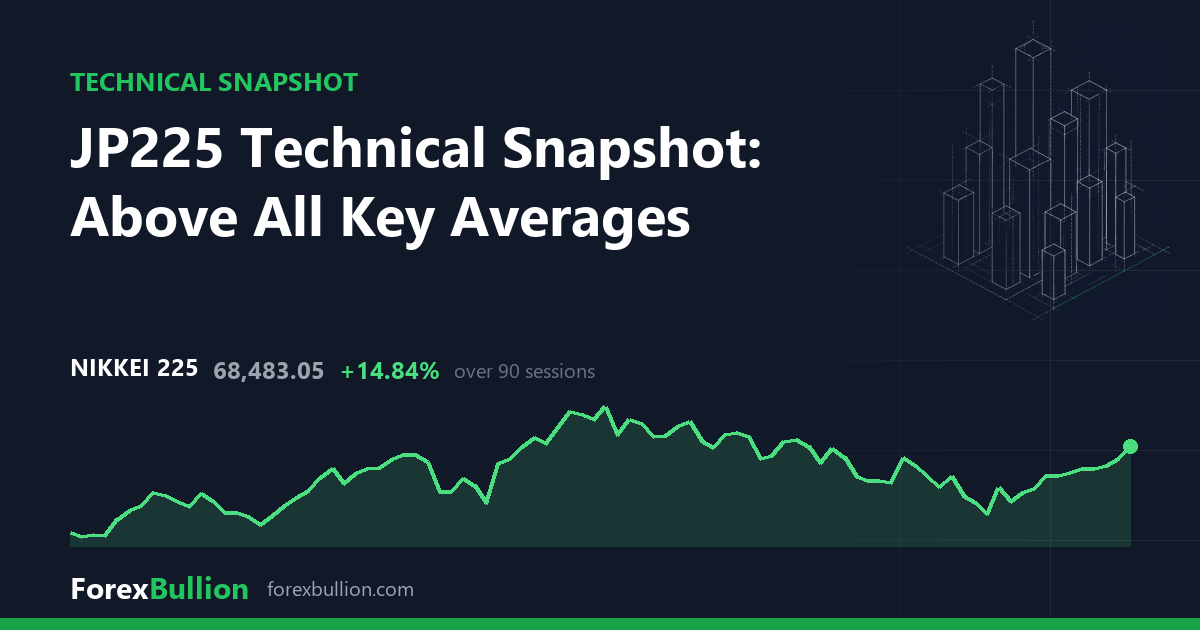
The Nikkei 225 (JP225) CFD last traded at 68,483.05, up 1.88% on the session.
Trend and moving averages
The structure reads as an uptrend, with price above the 50-day average and the 50-day above the 200-day. Price sits 5.12% above its 20-day SMA (65,147.28), 1.51% above its 50-day SMA (67,466.97), and 14.58% above its 200-day SMA (59,768.95). The widening gap from the long-term average to the short-term one describes a market trading well clear of its multi-month base. Context notes 3 consecutive higher closes.
Momentum and volatility
The 14-day RSI reads 60.7, a neutral value inside the 30-70 band. ATR over 14 days is 1,869.85 points, equivalent to 2.73% of price. That absolute reading sits in the 85th percentile of the past year, meaning current daily swings are wider than roughly four-fifths of readings over the trailing twelve months.
Price sits 6.98% below its 52-week high of 73,620.50 and 64.15% above its 52-week low of 41,720.00. The range-position figure places it at 84% of the 52-week span, toward the upper end. The 52-week high was set 44 sessions ago, while the low dates back 295 sessions. Over the last 20 days the swing high is 68,894.56 and the swing low 60,429.73; the 60-day swing high matches the 52-week high at 73,620.50 and the 60-day swing low is 60,429.73. Current price sits just under the near-term 20-day swing high.
Weekly picture
The weekly frame agrees with the daily read: an uptrend with price above the 20-week average and the 20-week above the 50-week. Price is 6.71% above the 20-week SMA (64,174.68) and 21.81% above the 50-week SMA (56,220.53). The weekly RSI is 62.5, also within neutral territory, and the last week closed up 3.5%. Both timeframes point the same direction.
Performance figures show a 4.04% gain over the past week, 0.32% over the month, 8.88% over the quarter, and 59.01% over the past year.
Descriptive technical summary generated by the ForexBullion Research Team from our own price feed. Not investment advice.