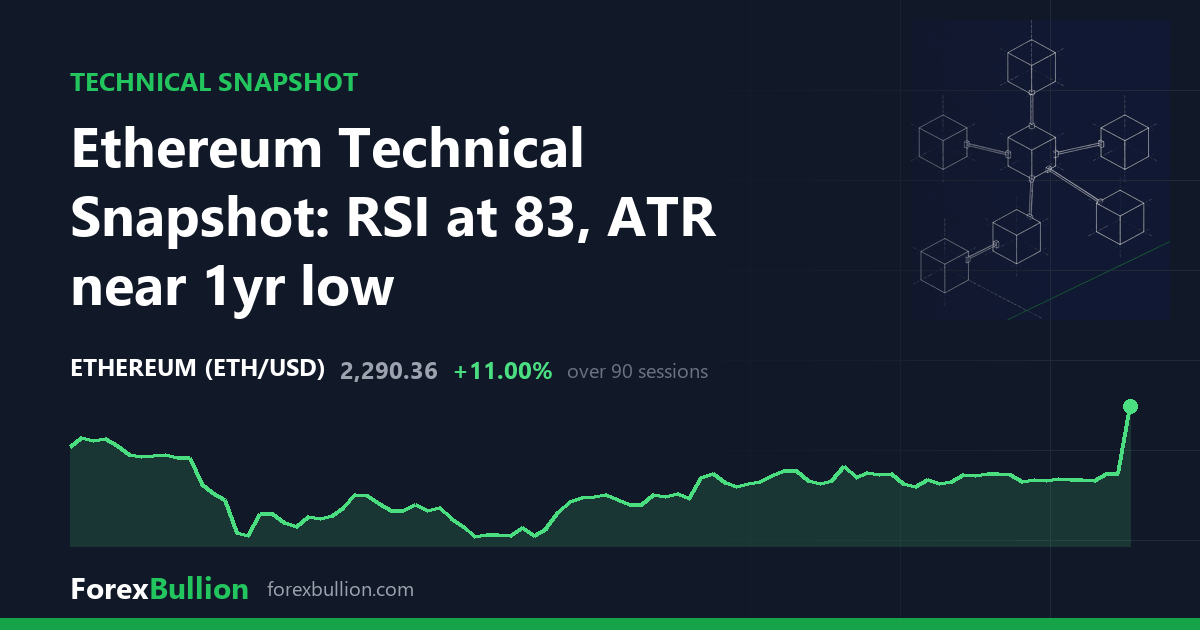
Ethereum (ETHUSD) last traded at 2290.36, up 19.53% on the session.
Trend and moving averages
The daily structure is described as above the 200-day average but with a mixed short-term structure. Price sits 20.16% above its 20-day SMA (1906.11), 22.93% above the 50-day SMA (1863.21), and 14.32% above the 200-day SMA (2003.38). All three averages are below the current price, and the 50-day sits under both the 20-day and the 200-day, reflecting the mixed alignment noted in the trend read.
Momentum and volatility
The 14-day RSI reads 83.3, a level described as elevated and often labelled overbought (at or above 70). The 14-day ATR is 72.85, or 3.18% of price. Against Ethereum’s own past year, that ATR sits in the 10th percentile — among the lowest volatility readings in twelve months, despite the size of the latest daily move.
Price has posted 3 consecutive higher closes.
Range position
Within its 52-week range, ETHUSD is 53.78% below the 52-week high of 4955.20 and 52.18% above the 52-week low of 1505.08. Its range position stands at 23, placing it in the lower quarter of the yearly span. The 52-week high was set 360 sessions ago, while the 52-week low is more recent at 74 sessions back.
Over the shorter windows, the 20-day swing high is 2326.99 and the 20-day swing low is 1819.84. The 60-day swing high is also 2326.99, with a 60-day swing low of 1509.92 — meaning the recent 20-day peak marks the highest point across the last 60 sessions, while the deeper low near 1510 was carved earlier in that window.
Weekly picture
The weekly frame is described as below the 50-week average but with a mixed short-term structure. Price sits 15.07% above the 20-week SMA (1990.34) but 12.65% below the 50-week SMA (2622.12). The weekly RSI reads 55.1, a far more neutral figure than the elevated 83.3 on the daily. Last week closed 22.24% higher. The two timeframes disagree: the daily shows price stretched well above all its averages with an overbought momentum reading, while the weekly still trades beneath its 50-week average with mid-range momentum.
Performance across the lookbacks shows a 21.57% weekly gain, an 18.78% monthly gain, and a 7.4% quarterly gain, against a 47.19% decline over the trailing year.
Descriptive technical summary generated by the ForexBullion Research Team from our own price feed. Not investment advice.