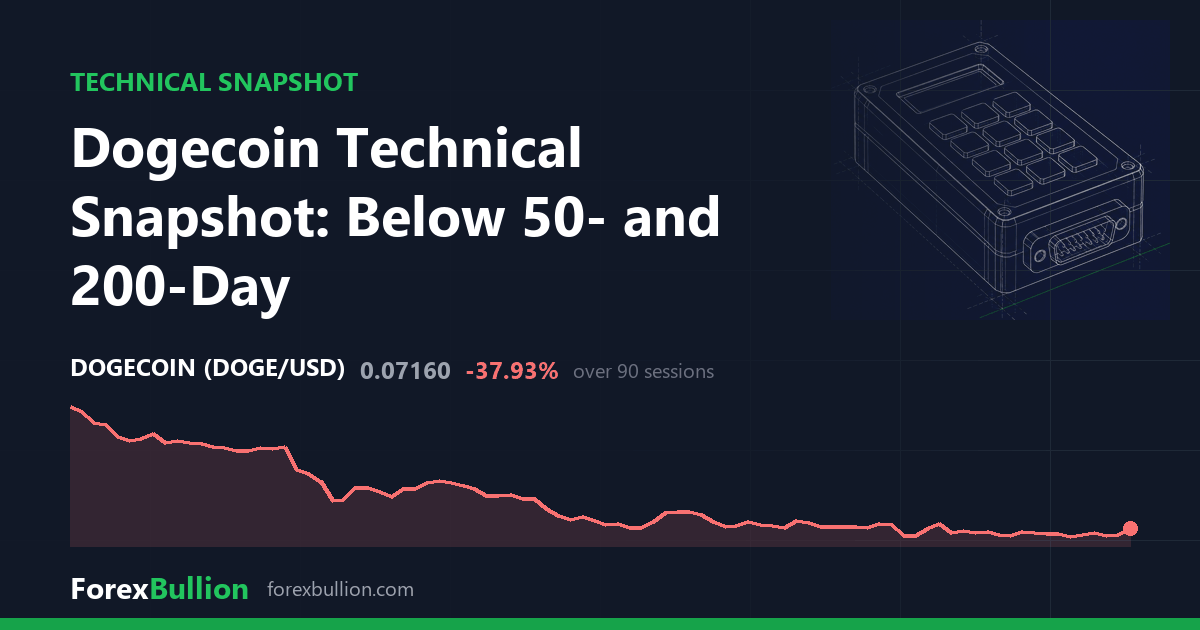
Dogecoin (DOGUSD) last traded at 0.0716, up 3.17% on the session.
Trend
The daily structure reads as a downtrend, with price below the 50-day average and the 50-day below the 200-day. Price sits 2.29% above its 20-day SMA (0.07) but 0.97% under its 50-day SMA (0.0723), and the gap to the 200-day SMA (0.0914) is wide at -21.66%. That spread between the short average, which price has reclaimed, and the longer averages captures the current position.
Momentum and volatility
RSI(14) reads 52.0, a neutral value sitting near the midpoint of the 30-70 band. ATR(14) is 0.0022, which works out to 3.07% of the last price. That volatility reading sits at the 0th percentile against Dogecoin’s own past year — the lowest ATR in twelve months. The move higher has come on two consecutive higher closes.
Range
Price sits 76.66% below the 52-week high of 0.30672, a level last seen 332 sessions ago, and 6.23% above the 52-week low of 0.0674, which was set just 10 sessions ago. That places DOGUSD at the 2nd percentile of its 52-week range — near the bottom of the band. The 20-day swing runs from a low of 0.0674 to a high of 0.0738, while the 60-day range widens to a high of 0.09081 over the same 0.0674 floor, so the recent low doubles as both the short- and medium-term extreme.
Over longer windows the performance is negative: the month is essentially flat at -0.14%, but the quarter shows -36.42% and the year -69.64%. The week reads +2.58%.
Weekly picture
The weekly timeframe agrees with the daily one. The weekly trend is also a downtrend, with price 17.89% below the 20-week SMA (0.0872) and 43.62% under the 50-week SMA (0.127), and the 20-week average below the 50-week. Weekly RSI(14) reads 35.5, lower than the daily 52.0 and closer to the low end of its band, though the last week closed up 3.62%. Both timeframes point the same direction, with the weekly averages further above price than the daily ones.
The year-to-date figure of -69.64% frames the longer-term backdrop against which the recent two-session bounce and one-year-low ATR sit.
Descriptive technical summary generated by the ForexBullion Research Team from our own price feed. Not investment advice.