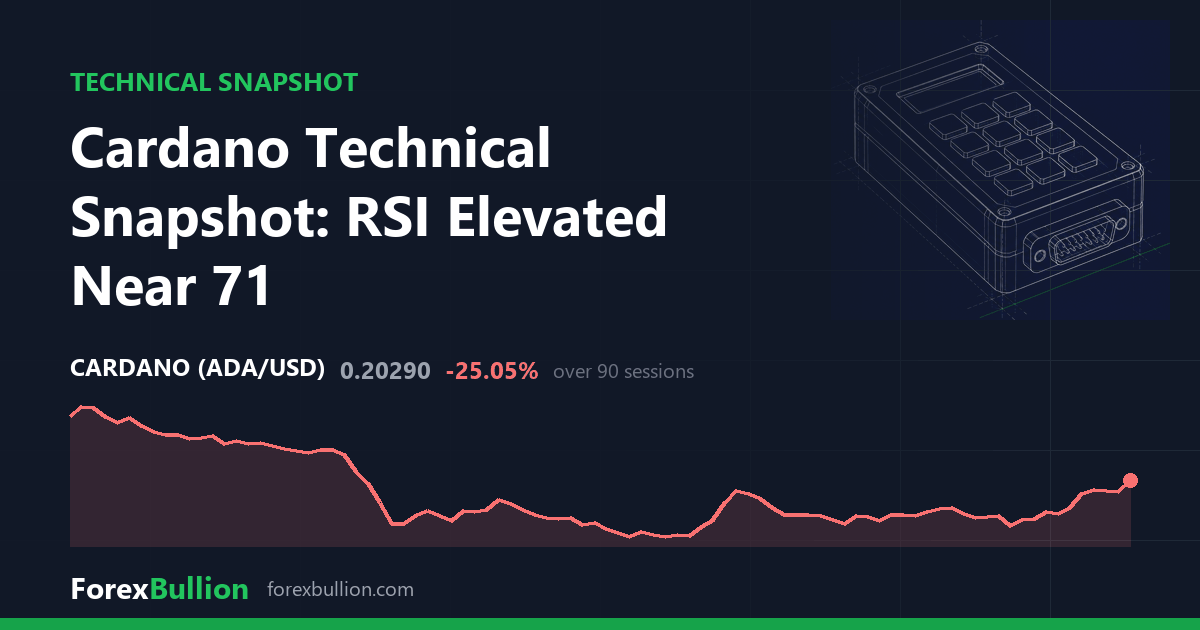
Cardano (ADAUSD) last traded at 0.2029, up 6.4% on the session.
Trend
The structure is described as below the 200-day average but with a mixed short-term picture. Price sits 17.01% above its 20-day SMA (0.1734) and 22.08% above its 50-day SMA (0.1662), reflecting a firm near-term footing. Against the longer-run 200-day SMA (0.235), however, price is 13.66% lower, so the broader backdrop remains beneath that benchmark.
Momentum and Volatility
The 14-day RSI reads 71.1, an elevated level that is often described as overbought. This is a description of the current momentum reading rather than a signal. On volatility, the 14-day ATR stands at 0.0111, equal to about 5.47% of the current price — a relatively wide daily range in percentage terms typical of crypto instruments.
Placing price within its range, ADAUSD is 58.04% below its 52-week high of 0.4836 and 47.03% above its 52-week low of 0.1380. The nearest 20-day swing high sits at 0.2110 with a 20-day swing low at 0.1532. The 60-day swing high is also 0.2110, while the 60-day swing low matches the annual low at 0.1380. Current price sits just under that 0.2110 swing high, its highest reference over both the 20- and 60-day windows.
Over longer horizons, performance shows a 16.61% gain on the week and 26.58% on the month, a 13.1% quarterly move, and a 53.11% decline over the year.
Descriptive technical summary generated by the ForexBullion Research Team from our own price feed. Not investment advice.
Correction, 9 September 2026. This article stated a 52-week high of 0.4836. The correct figure at the time of publication was 1.0198. Our 52-week window was computed over 252 trading sessions, which is a full year only for markets that close at weekends; for instruments trading seven days a week it covered about 36 weeks. The calculation was corrected on 8 August 2026 and the figures on our instrument pages now reflect a full calendar year; this notice records the error on the articles that carried it. No other figure in this article is affected.