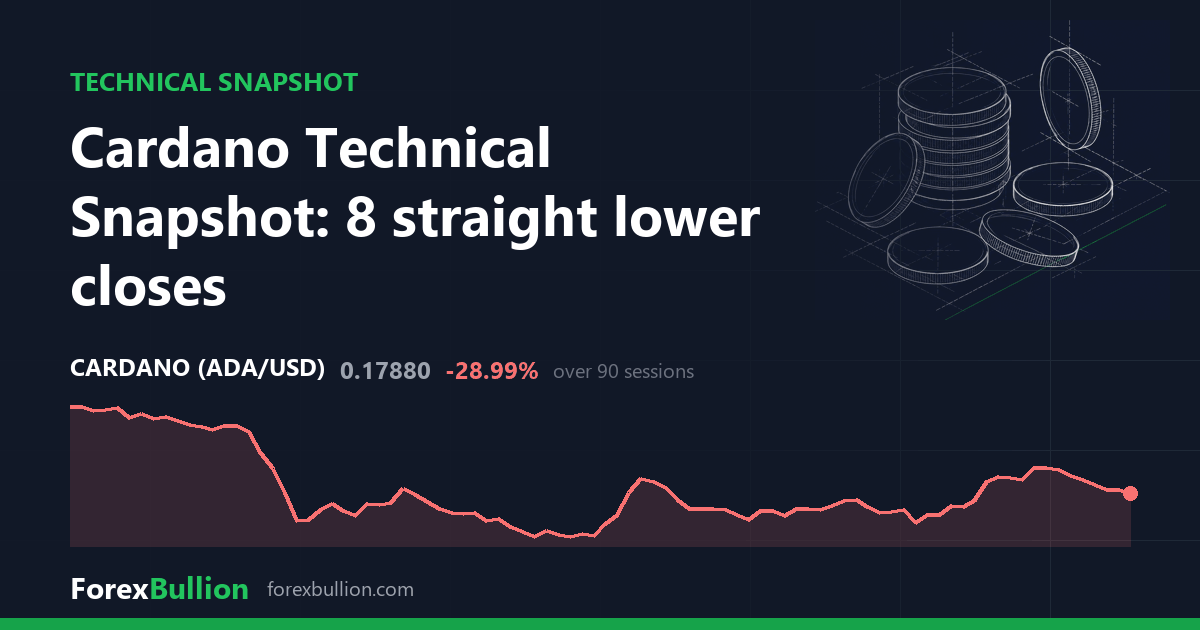
Cardano (ADAUSD) last traded at 0.1788, down 1.7% on the session.
Trend
The structure is described as below the 200-day average but with a mixed short-term picture. Price sits 21.68% under the 200-day SMA at 0.2283, marking the dominant longer-run gap. Closer in, the readings diverge: ADAUSD is 1.6% below its 20-day SMA at 0.1817 yet 4.26% above the 50-day SMA at 0.1715, so the two shorter averages tell different stories about the last few weeks.
Momentum and volatility
The 14-day RSI reads 48.1, a neutral value in the 30-70 band and sitting just under the midpoint. The 14-day ATR is 0.0091, equal to 5.09% of price. That absolute figure lands in the 2nd percentile of the past year, meaning daily ranges are near their narrowest of the last twelve months even as the price percentage stays elevated by crypto standards. Context adds that ADAUSD has posted eight consecutive lower closes.
Range
Price sits deep in its 52-week range, with a range-position reading of 5 out of 100. It is 81.9% below the 52-week high of 0.9877, an extreme set 362 sessions ago, and 29.57% above the 52-week low of 0.138. That low is more recent, printed 50 sessions back, and it also marks the 60-day swing low. The 20-day swing runs from a low of 0.1532 to a high of 0.211, with the 0.211 level also standing as the 60-day swing high. Current price sits between those near-term markers, closer to the lower end.
Weekly picture
The weekly view is a clearer downtrend: price is below the 20-week average with the 20-week below the 50-week. ADAUSD is 13.5% under its 20-week SMA at 0.2067 and 51.29% under its 50-week SMA at 0.3671. The weekly RSI reads 38.7, softer than the daily 48.1 but still above oversold, and last week closed down 7.84%. On this measure the timeframes broadly agree on weakness against the longer averages, though the daily chart’s position above its 50-day SMA is the point of nuance the weekly downtrend does not share.
Performance tables reinforce the split horizons: ADAUSD is down 10.15% over the past week and 29.83% over the quarter, yet up 11.54% over the month. Over the trailing year the instrument is down 81.1%.
Descriptive technical summary generated by the ForexBullion Research Team from our own price feed. Not investment advice.