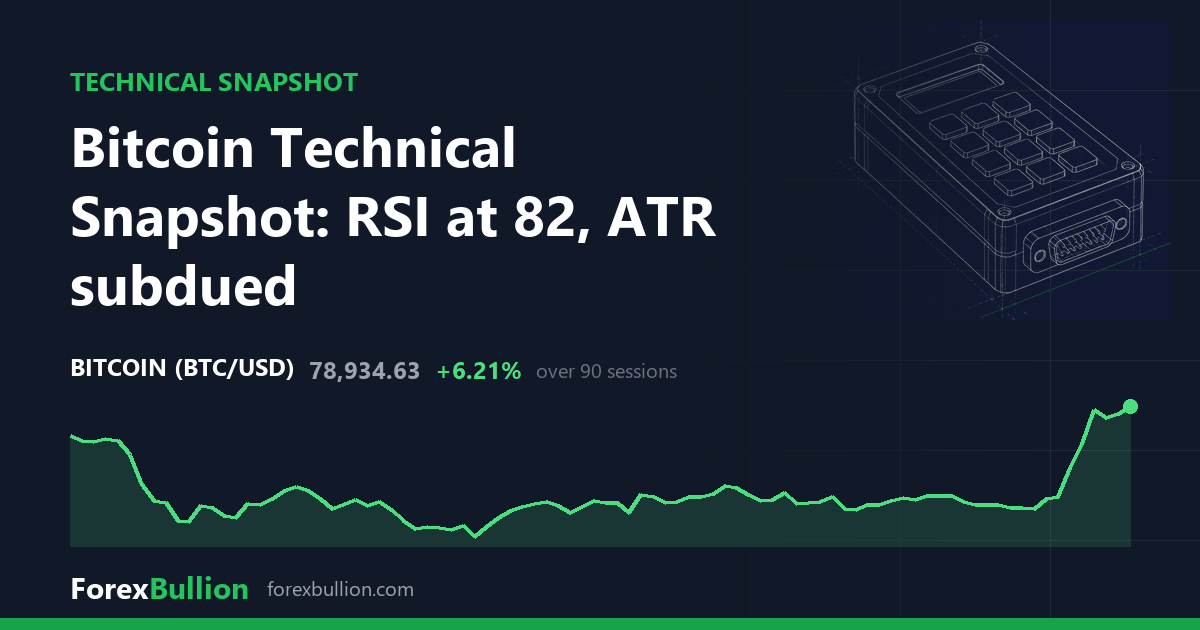
Bitcoin (BTCUSD) last traded at 78,934.63, up 1.56% on the session.
Trend
The daily read is described as above the 200-day average but with a mixed short-term structure. Price sits 14.26% above the 200-day SMA (69,084.51), 20.60% above the 50-day SMA (65,453.93) and 16.94% above the 20-day SMA (67,502.09). All three averages are stacked below the current price, and the shorter averages both trail the longer 200-day figure, which is the source of the mixed characterisation.
Momentum and volatility
The 14-day RSI reads 82.2, a level described as elevated (>=70, often described as overbought). The 14-day ATR stands at 2,240.83, or 2.84% of price. Against Bitcoin’s own past year that volatility sits at the 25th percentile, meaning current daily ranges are toward the quieter end of the trailing twelve months despite the sharp recent gains.
The advance has been recent: the tape shows 2 consecutive higher closes, and the one-week performance is +22.05% with the month at +20.83%.
Range
Price sits 37.49% below the 52-week high of 126,272.50 and 36.76% above the 52-week low of 57,718.92. That places it at the 31st percentile of its 52-week range. The 52-week high was set 322 sessions ago, while the low is more recent at 54 sessions back. Over the last 20 days the swing high was 79,984.77 and the swing low 62,466.56; the 60-day swing high matches at 79,984.77, while the 60-day swing low is the 52-week low of 57,718.92, so recent trading has spanned much of the wider two-month range.
Weekly picture
The weekly structure is described as below the 50-week average but with a mixed short-term structure. Price is 12.92% above the 20-week SMA (69,903.06) but 2.63% below the 50-week SMA (81,068.20). The weekly RSI reads 57.4, a far more moderate figure than the elevated daily reading of 82.2. This is a point of divergence: the daily timeframe shows price clear of all its averages with a stretched momentum reading, while the weekly timeframe still has price under its 50-week average with mid-range momentum. The last weekly change was +1.56%.
Over the trailing year Bitcoin is down 28.34%, with the quarter up 4.10%.
Descriptive technical summary generated by the ForexBullion Research Team from our own price feed. Not investment advice.