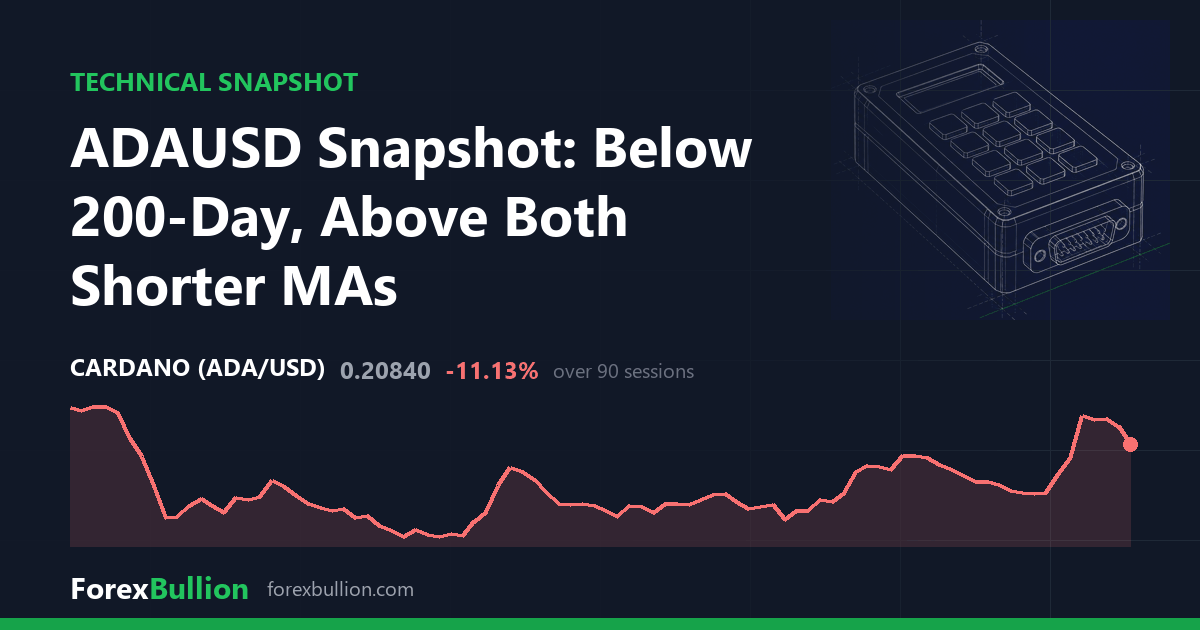
Cardano (ADAUSD) last traded at 0.2084, down 5.66% on the session.
Trend
The structure is below the 200-day average but with a mixed short-term structure. Price sits 6.65% above its 20-day SMA (0.1954) and 15.97% above its 50-day SMA (0.1797), yet remains 6.38% under its 200-day SMA (0.2226). That split leaves the shorter averages beneath the longer one, with price wedged between the two shorter moving averages and the 200-day line above.
Momentum and volatility
The 14-day RSI reads 59.2, a neutral value inside the 30-70 band. ATR over 14 days is 0.015, equal to 7.2% of the current price. That volatility reading sits at the 41st percentile of the past year, near the middle of Cardano’s own 12-month range rather than at an extreme. The tape shows 2 consecutive lower closes into this reading.
Range and levels
Price is 78.15% below the 52-week high of 0.9537, a peak set 346 sessions ago, and 51.01% above the 52-week low of 0.138, which was posted 61 sessions back. Range position stands at 9, placing ADAUSD near the bottom of its 52-week band. The 20-day swing high is 0.2581 with a 20-day swing low of 0.1708; over 60 days the swing high is also 0.2581 and the swing low extends to 0.1409. Those are the nearest structural markers on the daily frame.
Over longer windows the picture is layered: ADAUSD is up 11.62% on the week and 34.45% on the month, but down 11.99% on the quarter and 75.94% across the year.
Weekly picture
The weekly frame is described as below the 50-week average but with a mixed short-term structure, echoing the daily read. Price sits 2.21% above the 20-week SMA (0.2039) but 38.94% below the 50-week SMA (0.3413), a wide gap between the two weekly averages. The weekly RSI is 44.5, softer than the daily 59.2 and below the midpoint, while last week closed down 8.03%. The two timeframes broadly agree that price holds above its shortest average while remaining under its longest, though the weekly momentum reading is the weaker of the two.
Across the trailing year, Cardano is down 75.94%, and it currently sits near the low end of its 52-week range at a range position of 9.
Descriptive technical summary generated by the ForexBullion Research Team from our own price feed. Not investment advice.