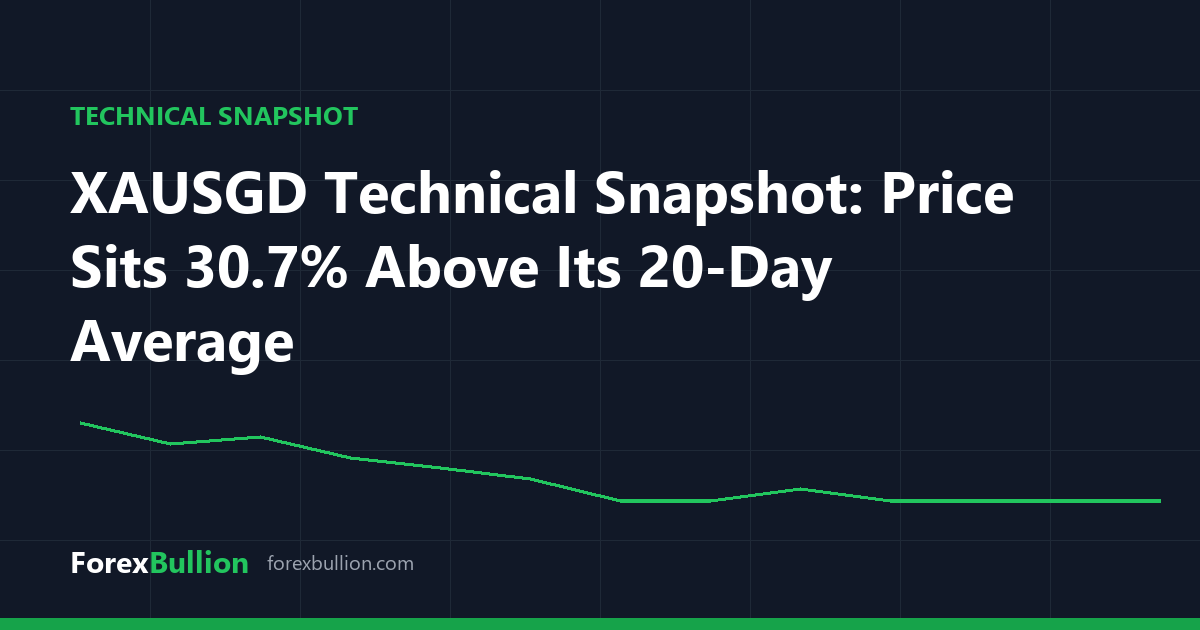
Gold / Singapore Dollar (XAUSGD) last traded at 5228.96, with the session change registering at +67.04%.
Trend & Moving Averages
With only 87 daily bars available, our read is flagged as “insufficient history for a long-term trend read,” and the 200-day average is not yet computable. Against the shorter averages, price sits well above both benchmarks: it is 30.72% above its 20-day SMA (4000.24) and 25.0% above its 50-day SMA (4183.22). The 20-day average also sits below the 50-day, a configuration worth noting alongside the elevated distance of price from both lines.
Momentum & Volatility
The 14-day RSI reads 53.3, placing it in neutral territory within the 30-70 band — neither stretched high nor low by this measure. Volatility is notable: the 14-day ATR stands at 2183.48, which is a substantial 41.76% of the current price, pointing to very wide average daily ranges relative to where price trades.
Range & Levels
Price sits 15.6% below its 52-week high of 6195.67 and 71.53% above its 52-week low of 3048.39. Nearer term, the 20-day swing high is 5429.24 and the 20-day swing low is 3064.78, while the 60-day swing high and low come in at 5866.77 and 3048.39 respectively. These mark the recent extremes that frame the current reading.
Over the longer stretch, performance shows a quarter change of -12.84%, alongside a week change of +1.28% and a month change of +0.86%.
Descriptive technical summary generated by the ForexBullion Research Team from our own price feed. Not investment advice.