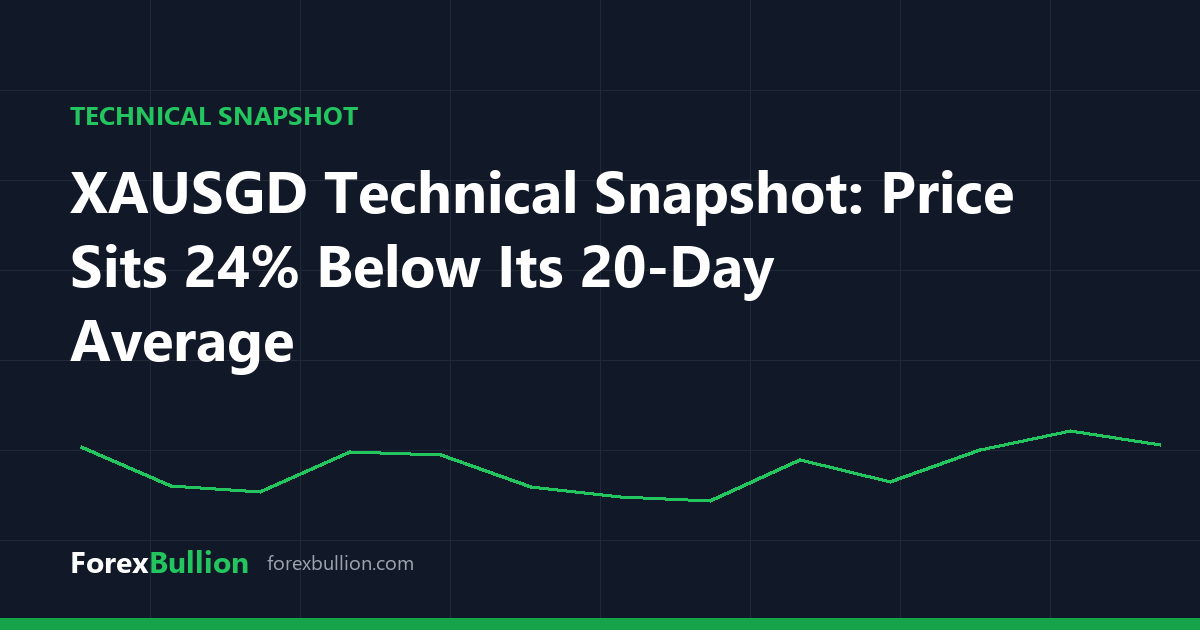
Gold / Singapore Dollar (XAUSGD) last traded at 3104.33, down 39.87% on the session.
Trend and moving averages
With only 83 daily bars available, our read is flagged as “insufficient history for a long-term trend read,” and the 200-day average has not yet been computed. What can be measured shows price sitting well below its shorter averages: it is 24.19% under the 20-day SMA (4094.82) and 24.88% under the 50-day SMA (4132.24). That gap describes a market trading far beneath its recent mean readings.
Momentum and volatility
The 14-day RSI reads 46.8, which falls in the neutral 30-70 band — neither an overbought nor an oversold reading. Volatility is elevated: the 14-day ATR stands at 2180.58 in price terms, an unusually large 70.24% of the current price, indicating exceptionally wide daily ranges relative to where price now sits.
Position within the range
Price is 49.9% below its 52-week high of 6195.67 and 1.84% above its 52-week low of 3048.39, placing it near the lower end of its yearly range. That 3048.39 low is also the swing low across both the 20-day and 60-day windows. On the upside, the 20-day swing high sits at 5429.24 and the 60-day swing high at 6058.39, both well above the current level and useful only as reference points from the recent record.
Over longer horizons the performance figures show a decline of 40.66% on the week, 40.37% on the month and 16.26% on the quarter.
Descriptive technical summary generated by the ForexBullion Research Team from our own price feed. Not investment advice.
