UKOil is trading at 81.58, down 3.95% on the session.
Trend
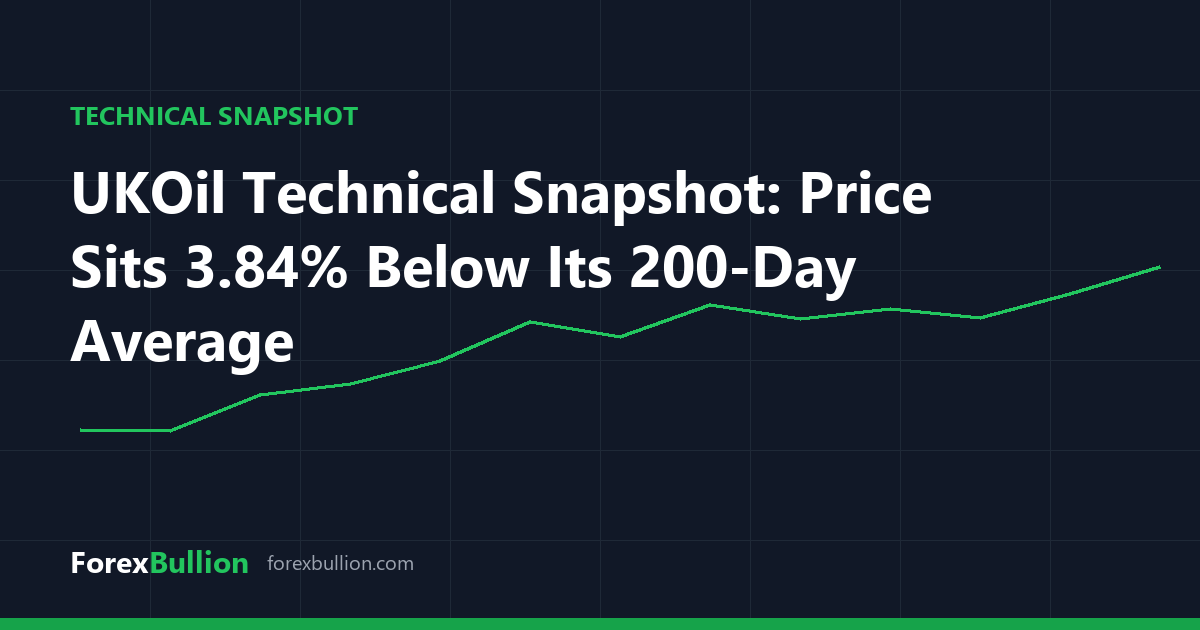
The structure reads as a downtrend, with price below the 50-day average and the 50-day itself below the 200-day. Price sits 2.88% under its 20-day SMA (84.00), 2.99% under its 50-day SMA (84.10), and 3.84% under its 200-day SMA (84.84). All three averages are stacked above the current price, and they cluster within a narrow band between roughly 84.00 and 84.84.
Momentum and volatility
The 14-day RSI reads 44.8, which falls in the neutral 30–70 zone — neither overbought nor oversold on this measure. The 14-day ATR stands at 3.80 in price terms, equal to about 4.65% of the current price, a comparatively wide daily range for this instrument.
Range and levels
Price is 32.31% below its 52-week high of 120.53 and 38.52% above its 52-week low of 58.90, placing it in the lower half of the yearly span. The nearest 20-day swing points are 95.50 above and 71.65 below, while the wider 60-day window frames a swing high of 113.33 and a swing low of 70.86. These are prior turning points from the data, offered purely as reference markers.
Over longer windows the record is mixed: down 9.54% on the week and down 27.11% on the quarter, but up 12.3% on the month and up 26.88% over the year.
Descriptive technical summary generated by the ForexBullion Research Team from our own price feed. Not investment advice.